Quantify Your Health with 14-Predictive Biomarkers
Lab tests to quantify repair deficit

These are the 14 predicted biomarkers I rely on in my practice to gauge how healthy someone is or how close to severe illness, disability, and death they are. This is a very unusual panel. You won’t find it elsewhere.
Before you run out and buy labs, schedule an assessment with myself or a member of my team. We can help you find the right labs, so you don’t waste time and money on the wrong ones for you. Schedule an evaluation with a member of my team today.
A Different Kind of Risk Assessment
Most of our patients find themselves wondering:
“Why do I feel so sick?”
“Why do I have fatigue, brain fog, pain, poor sleep, and gut or skin issues?”
“Could I have an autoimmune disease?”
“How does it change my life?”
“What does it mean for my future?”
This is all tied to chronic inflammation. Chronic inflammation always comes back to what we call repair deficit, or a lack of repair relative to damage to cells and tissues. Chronic inflammation, and therefore repair deficit, is also the root cause of cancer, heart disease, metabolic dysfunction, and more.
What if there were a panel we could order to determine your risk of chronic disease?
This has been my project the last week.
The Repair Deficit Panel
Our new lab panel includes:
Anti-nuclear antibody (ANA)
Albumin (CMP)
Bilirubin (CMP)
Cardiac CRP
Ferritin
Iron panel
Magnesium, serum
Copper
Zinc
Homocysteine
Urinalysis
Free T3
A1C
Fibrinogen activity
I based my decisions on what to include based on reviewing thousands of tests with patients over the past several years. These are labs that are frequently abnormal in our patients and that are strongly correlated with long-term disease and even premature death.
Why These Markers?
I have spent years reviewing labs with patients to determine the most important biomarkers to predict health and disease.
Here are the markers I care most about optimizing for the health and well-being of our patients.
Before I dive in, let me just say that this level of detail may be overwhelming. I get it. Patients who come to our practice don’t want an essay - they want answers. If you’re ready to get help, book an Assessment with myself or a member of my team today.
The first marker, and the most striking in terms of the risk it confers, is the anti-nuclear antibody (ANA).
Anti-Nuclear Antibody
Anti-Nuclear Antibodies (ANA) are antibodies (proteins made by the immune system) that target the nucleus of your cells.
Why would the body make these antibodies?
Most people will tell you it’s because the body is attacking itself. I believe a better way to think about it is that the body is trying to repair itself, and the antibodies tell the body where to send help.
Regardless of why the body might produce anti-nuclear antibodies, a positive test is associated strongly with an increased risk of death. This is some of the most compelling data I saw in reviewing labs for their predictive value:
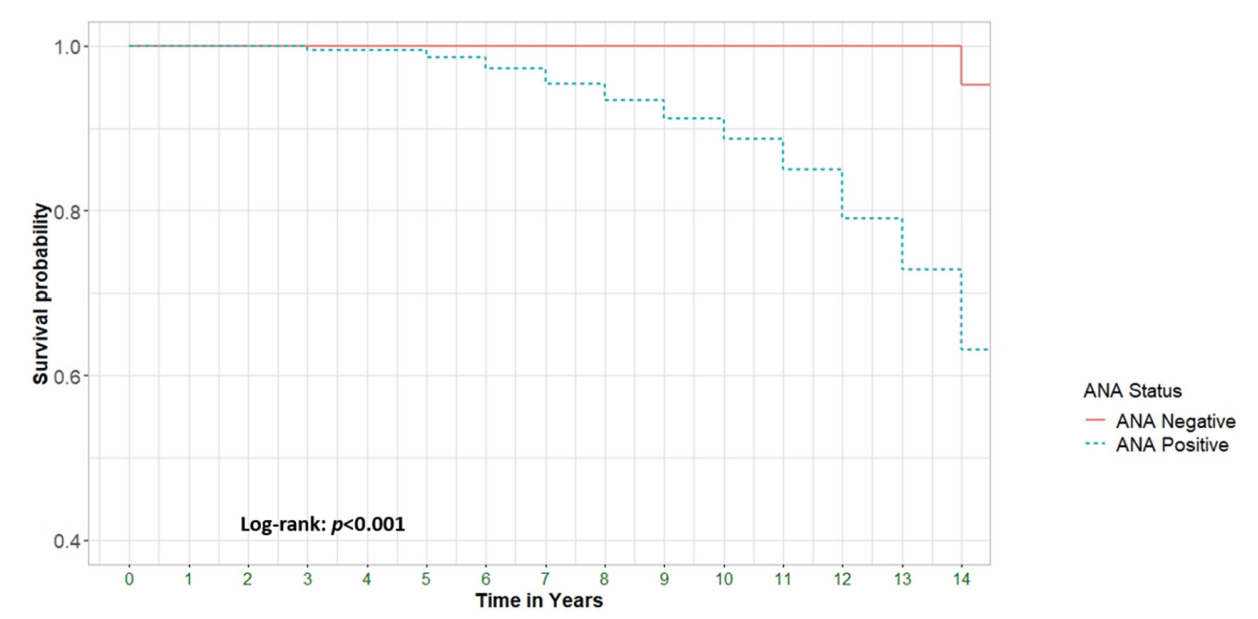
Interestingly, patients without any signs of autoimmunity had a higher risk of death when their ANA was positive. Why is a mystery to me and to the authors of the paper. They did not even hypothesize as to why this might be.
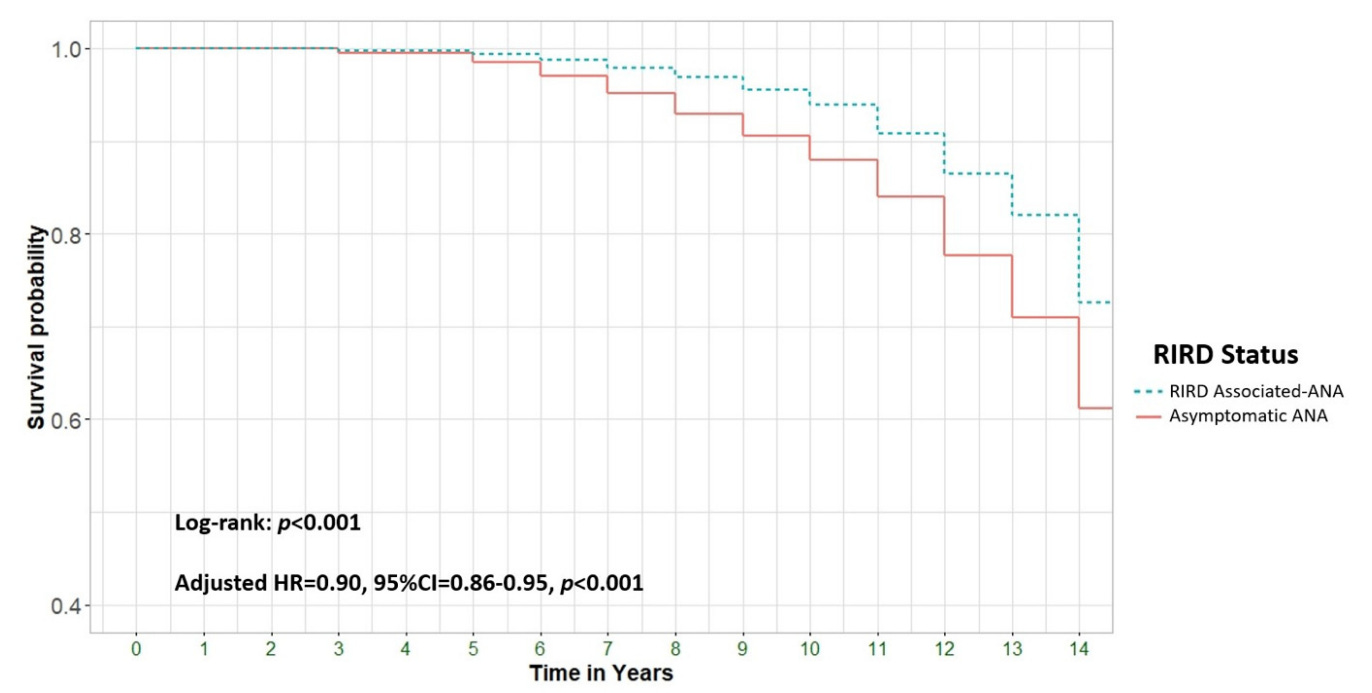
From: Mortality in Antinuclear Antibody-Positive Patients with and Without Rheumatologic Immune-Related Disorders: A Large-Scale Population-Based Study
Key Markers in the CMP
The CMP contains two key markers linked to early death and disease. They are:
Bilirubin
Albumin
Bilirubin
Abnormal elevations in bilirubin indicate poor elimination of toxins via the biliary tract. Look at these before and after bilirubin levels from a patient of ours with copper toxicity:
Follow up: 8/28/2025 Initial: 3/28/2025

Our supplement protocols brought this down. They are forthcoming (with the book and in blog posts).
Here is the association between bilirubin and all-cause mortality (risk of death):
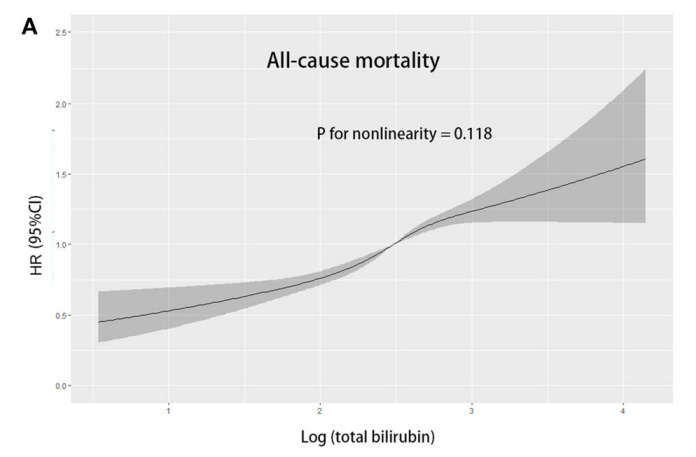
From: Association of total bilirubin with all-cause and cardiovascular mortality in the general population
Why do high bilirubin levels go along with repair deficit? Bile carries toxins out of the body. Obstruct the flow of bile and you get elevated bilirubin levels. Obstruct the flow of bile and toxins will begin to accumulate.
The elevated bilirubin level above had been present for years for this patient. Along with it we found that her copper levels were extremely elevated.
We will cover copper in more detail later.
She is feeling better as her bilirubin comes down. Her copper hasn’t budged, but she has been accumulating it for years. We will trend it until it is normal again.
Albumin
Albumin is an indicator of both nutritional status and liver function (indirectly). A low albumin is strongly associated with a higher risk of death.
Here is a graph of albumin levels by tertile and mortality:
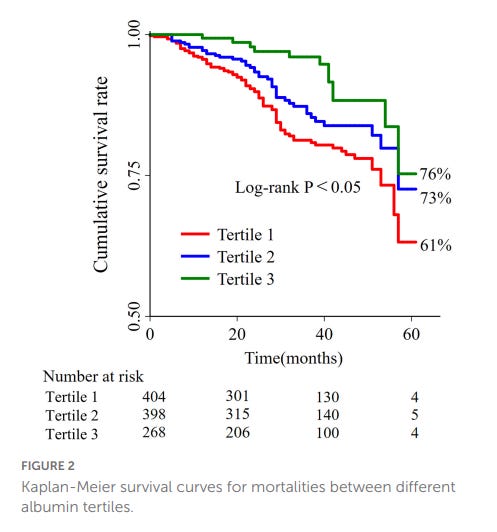
From: J-shaped association between serum albumin levels and long-term mortality of cardiovascular disease
As you can see, patients in the lowest tertile have a much higher risk of death.
Interestingly, the ratio of cardiac C-reactive protein (cardiac CRP, also known as high-sensitivity CRP) to albumin is also highly predictive of mortality:
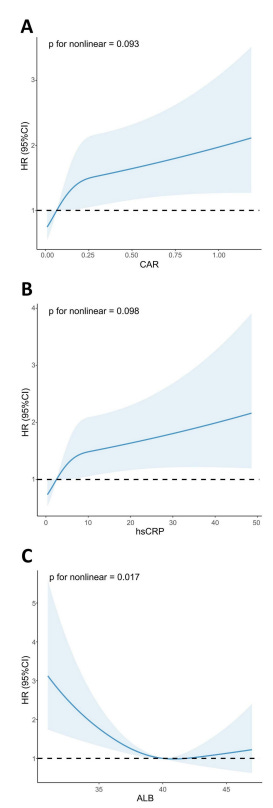

Cardiac CRP itself is strongly correlated with ACM. Ideally, your cardiac CRP is less than 0.500, however, because the marker is so sensitive the lowest risk group is marked as below 1.00.
Here is a graph of all-cause mortality based on cardiac CRP:
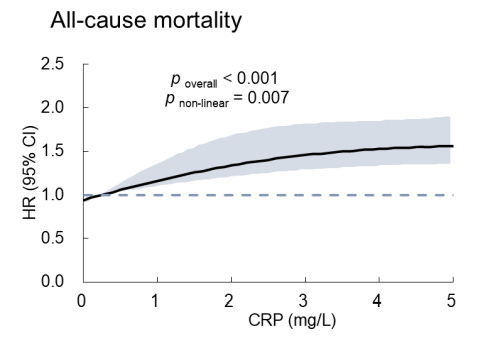
From: Association of high-sensitivity C-reactive protein to albumin ratio with all-cause and cardiac death in coronary heart disease individuals: A retrospective NHANES study
A patient of ours started with a cardiac CRP of 7.50.
Here are two cardiac CRP results since starting with us:

The most recent result is dated 3/31/2025.
We have dropped this person’s risk of heart disease from high risk to moderate risk, and they should soon be in the low risk category.
Ferritin
Ferritin is a protein that binds iron. It also binds heavy metals. As ferritin rises, so does risk of death. I suspect that ferritin levels also predict total-body heavy metal burden, but I have yet to confirm this.
Here is a graph:
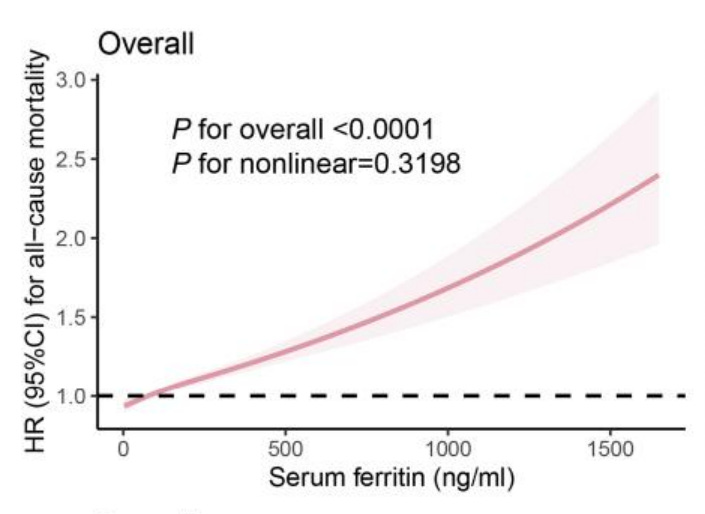

From: Iron Metabolic Biomarkers and the Mortality Risk in the General Population: A Nationwide Population-Based Cohort Study
As iron accumulates in the body, it generates more and more oxidative stress. People with iron-overload “rust out” at a faster pace.
Iron also keeps close company with heavy metals (this is my anecdotal experience).
Here are two cases of elevated iron in the setting of mercury toxicity.
These were both in young men (under 40) with elevated iron and mercury levels.
They both had fatigue, gastrointestinal issues, and severe brain fog.
First case, first round of labs:
Mercury 73.0 nmol/L (normal < 25.0)
Iron 181 ug/dL (normal < 180)
Ferritin 358 ng/ml (normal < 350, and I would say ideal is less than 150 in men)
No one else put together that he was dealing with a combination of iron-overload and mercury toxicity. Blood donation, mineral supplementation, and various detoxification protocols resolved his symptoms.
Second case, first round of labs. Note the significant elevation in mercury and low levels of minerals across the board.
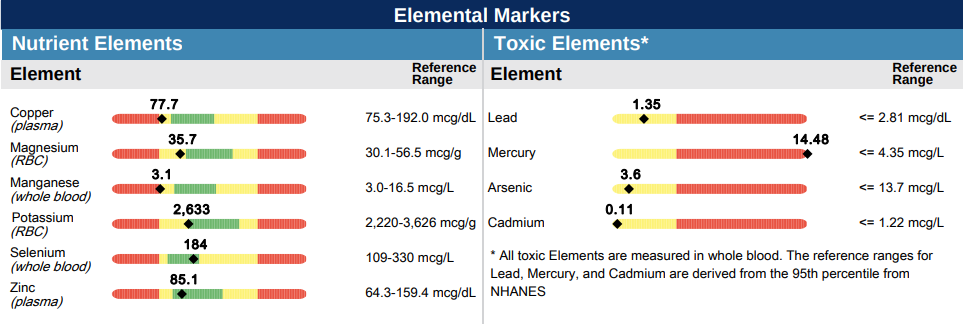
Hair mercury levels are consistent with significant toxicity. We expect significant mercury toxicity in cases with hair levels over 0.100 mg %. A 0.340 mg % of mercury is one of the highest we have ever seen.
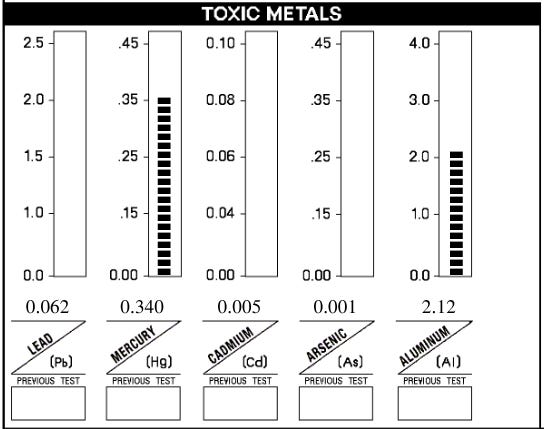
Here is his blood level of ferritin:

Most people would ignore this ferritin. In my experience, anything over 150 is concerning for occult or hidden iron overload. For example, the gentleman in the first case had multiple ferritin readings between 100 and 200, and only one at 358. Yet he described the benefits of blood donation as, “life-changing.” Ferritin can move one or two hundred points in either direction from day to day. I have a low threshold for recommending blood donation for this reason.
For every 100 point elevation in ferritin above 200 ug/L, the Copenhagen Heart Study showed a 10% increase in risk of death. The highest ferritin levels (> 600 ug/L) had a life expectancy of 55 years, while those in the low category (< 200 ug/L) had a life expectancy of 79.
Iron confuses people for good reason. Its biochemistry is highly complex. Yet optimizing iron levels is critical for vitality.
This is why I donate blood every two months and frequently recommend it to patients.
Iron Panel
The marker I am most curious about in the iron panel is the transferrin saturation %. Transferrin is an iron transport protein. It is perhaps a better indicator of total iron levels than ferritin.
Our lowest risk of death is on the lower end of a “normal” transferrin saturation %:
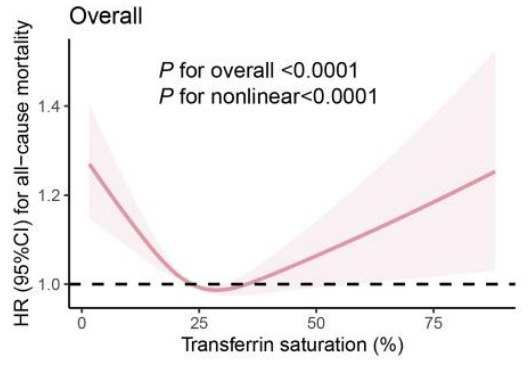

From: Iron Metabolic Biomarkers and the Mortality Risk in the General Population: A Nationwide Population-Based Cohort Study
As iron levels rise, we see wasting of critical minerals like magnesium, copper, and zinc. These minerals are also strongly predictive of disease.
You need a full iron panel and a ferritin to even begin to estimate a patient’s iron status. Even then, the results can be misleading.
Magnesium (Serum)
Magnesium has to be tightly controlled within your body. We often see magnesium deficiency in patients related to excess loss and inadequate supply. Magnesium is one of the most common supplements we recommend in our practice.
Here is the relationship of magnesium to mortality (heart disease and sudden cardiac death):
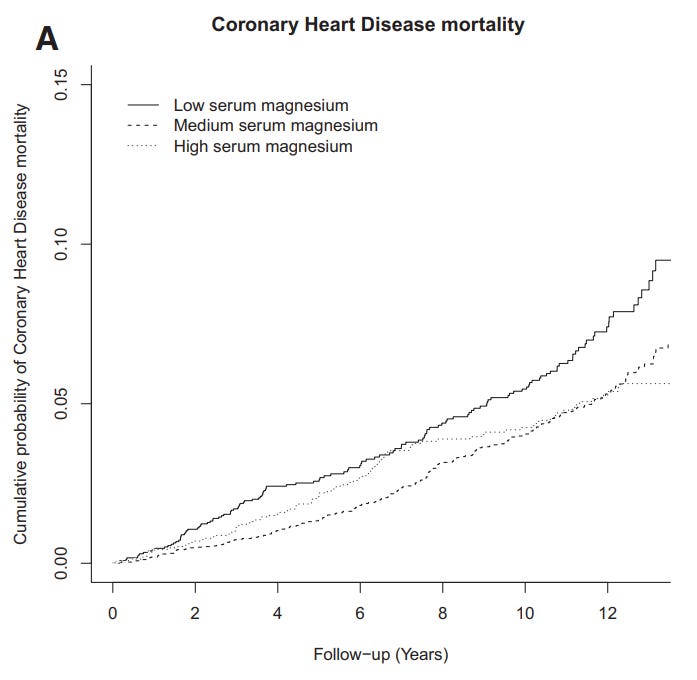
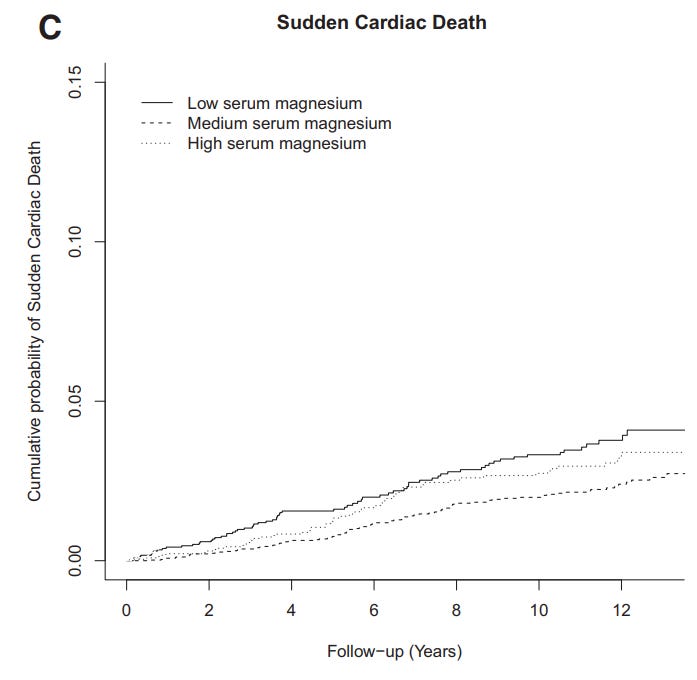
From: Serum Magnesium and the Risk of Death From Coronary Heart Disease and Sudden Cardiac Death
Many people in the functional medicine community say that red blood cell magnesium is a superior marker to serum magnesium. The truth is that they are practically equivalent.
Those of you who are not regularly supplementing with magnesium are likely low (depending upon environmental, dietary, and lifestyle factors). Those of you who are may be in the optimal range. In any case, we always optimize magnesium levels.
Another critical nutrient we often see abnormalities in is copper. Copper is vital to life, but also extremely dangerous when elevated.
Copper
Copper is essential for many cellular processes, particularly energy generation. The problem with copper is that it tends to get out of control in our modern world. First, inorganic copper can leach into water from copper pipes, poisoning your water. Inorganic copper as copper sulfate is used on “organic” fruits and vegetables as a pesticide. Copper tends to be retained by the body in the presence of higher levels of estrogens. This means that we frequently see extreme elevations of copper in women who are on birth control. We likewise see elevations in copper in women who have copper intra-uterine devices. Last, we see copper elevations in people who consume plant-based proteins.
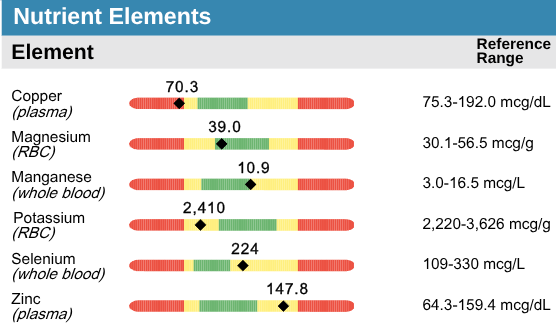
Here is an example of what we see in hair:
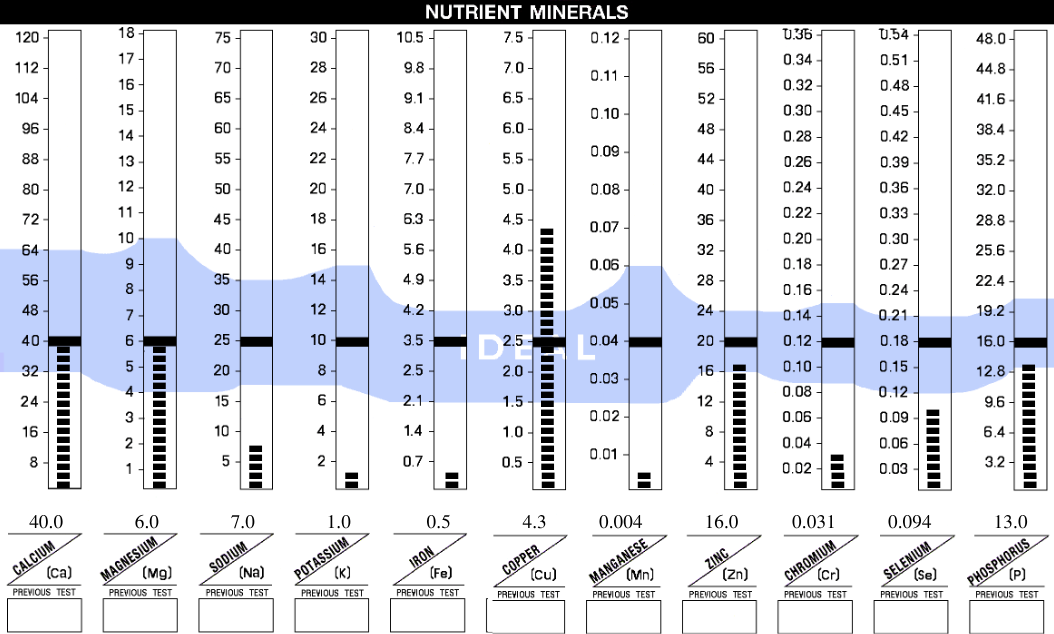
We must keep copper tightly controlled within the blood for optimal health.
We can also drive copper too low with other divalent cations like zinc, manganese, or iron.
Here is an example of copper deficiency induced by excess zinc supplementation:
Here is an example of copper toxicity in the blood:

Copper creates oxidative stress as it accumulates, which makes blood copper levels a strong predictor of mortality. The effect is striking.
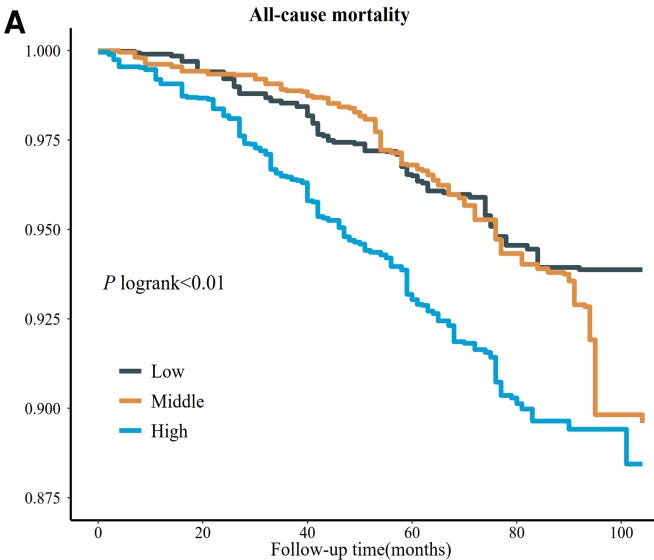
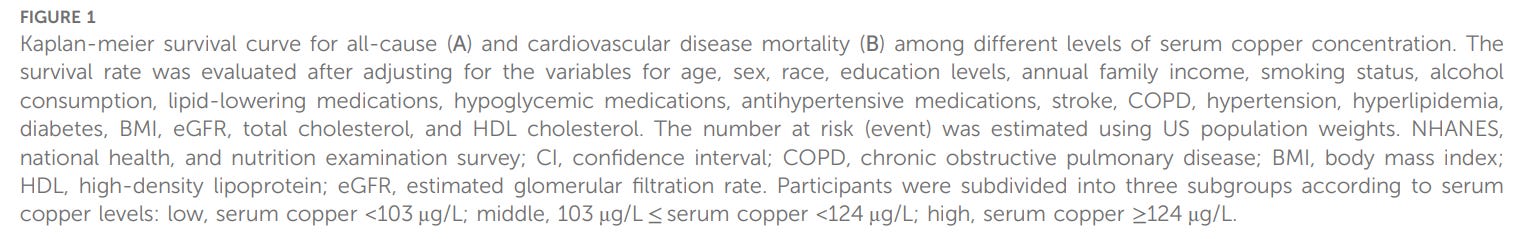
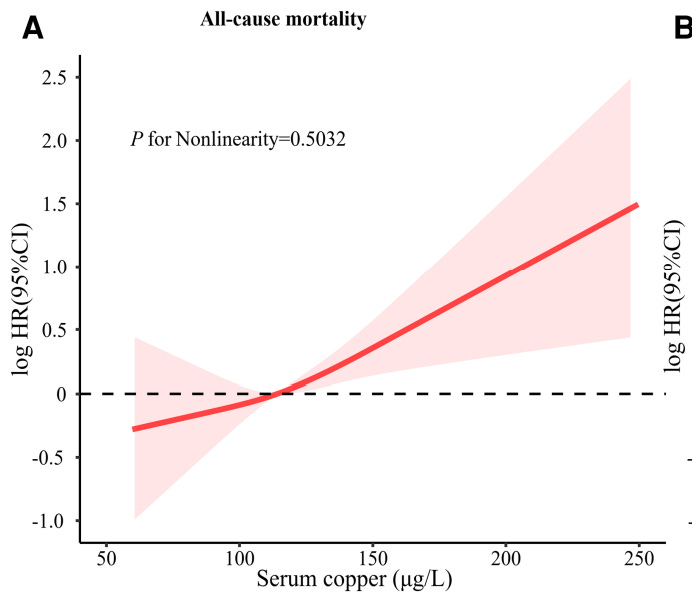
From: High serum copper as a risk factor of all-cause and cause-specific mortality among US adults, NHANES 2011-2014
You have to be careful with copper. Many of you have copper levels far in excess of ideal, and it is a major part of your problem.
Our goal copper is between 80 and 100 (error rate of the test day-to-day is about 10%).
Zinc
Zinc is an essential mineral. Most people today are low in zinc. Why is this? The answer is stress, heavy metals, excess copper, and excess manganese in our environment.
Zinc is essential for health and longevity. Low zinc levels strongly predict risk of chronic disease and death. However, you can also get too much zinc and create copper deficiency (see above).
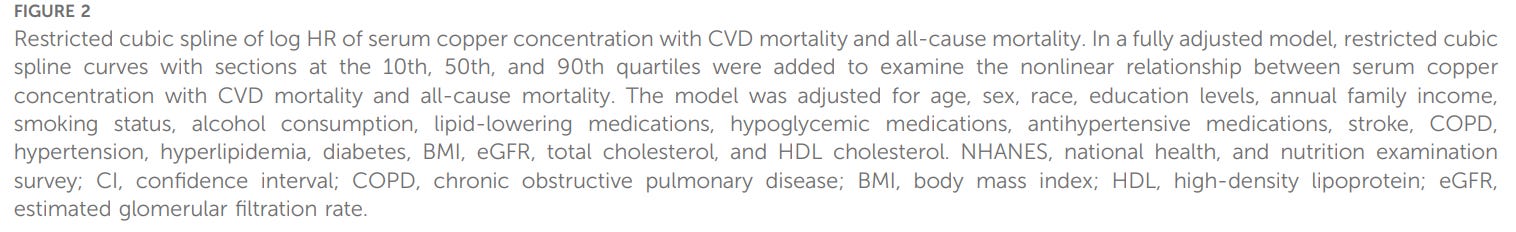
Here is the relationship between zinc and mortality:
From: Low serum zinc concentrations predict mortality in patients referred to coronary angiography
You want to be in the top quartile for zinc. The difference in survival between the top quartile and bottom quartile is significant.
Most of you are below the top quartile.
Here are the quartile cutoff values:
Fourth quartile > 96 mcg/dL
Third quartile = 87-96 mcg/dL
Second quartile = 78-86 mcg/dL
First quartile < 78 mcg/dL
Here are four low zinc levels I saw this week in practice:


Almost no one comes into the practice with ideal zinc levels. We give patients as much as 100 mg per day, depending on the case, to correct this. We trend zinc levels until they are optimal.
Homocysteine
Homocysteine is a marker of methylation status. The higher it is, the higher your risk of disease and death. Multiple B-vitamins affect methylation and therefore homocysteine levels, including B-6, B-12, and folate. Homocysteine is partly a marker of nutritional status.
Homocysteine is one of our best markers for total toxic burden. The higher homocysteine levels, the higher your total toxic burden. Why? Because toxins interfere with methylation. Heavy metals are perhaps the most potent toxins when it comes to inhibiting methylation.
Here is a graph of homocysteine levels versus risk of death:

From: Association between Homocysteine Levels and All-cause Mortality: A Dose-Response Meta-Analysis of Prospective Studies
We trend homocysteine levels until they are under 10 at least, and ideally under 9. What many people don’t realize is that it is hard to drop homocysteine under 9 without restricting protein in your diet. This might lead to an improvement in longevity, but it will lead to a reduction in performance.
Urinalysis
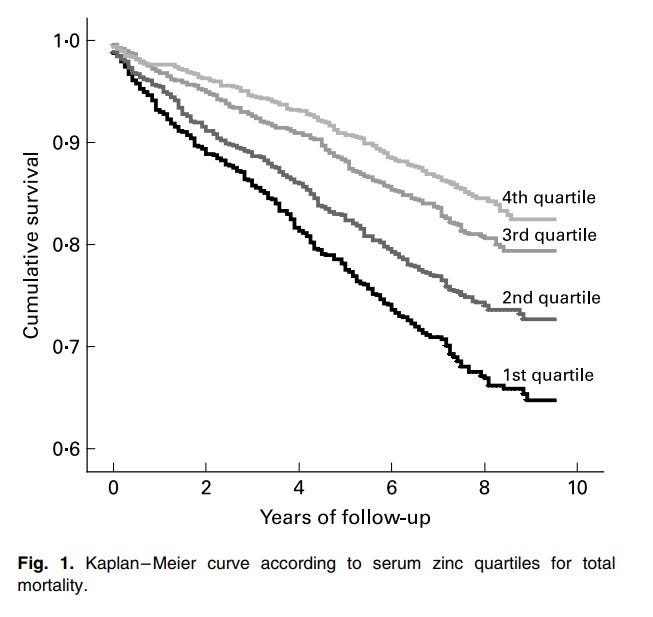
What interests me most in a urinalysis is urinary pH, which is strongly correlated with longevity and vitality. Morning urinary pH is a strong marker for your mineral status. The greater your mineral reserves, the greater your vitality. The best example of this is bone density. Your bones are not just made out of calcium, but over a dozen other elements and trace elements. The stronger your bones, the greater your mineral reserves.
When urinary pH drops below 7.0, it indicates that your mineral reserves are in decline. We look for urinary pH values that cluster around 7.0 (above or below, but not too far in either direction) as a marker of overall vitality.
Here is a graph of urinary pH and mortality in the ICU:
From: Could Urine pH be a New Parameter for Mortality?
We trend urinary pH until it is around 7.0 (first morning void). We replete minerals and correct vitamin deficiencies using testing (particularly HTMA) to optimize urinary pH.
Free T3
Free T3 is our best marker for thyroid function and status. The higher your free T3, the longer you are likely to live and the better your health.
What determines free T3 status? You need nutrients to make it. Thyroid hormone is a circadian hormone, meaning it is influenced by light and electromagnetic fields.
We do everything possible to optimize free T3 without prescription thyroid hormone. This means optimizing your diet, lifestyle, and environment for natural thyroid hormone production.
Here is the effect of free T3 on survival:
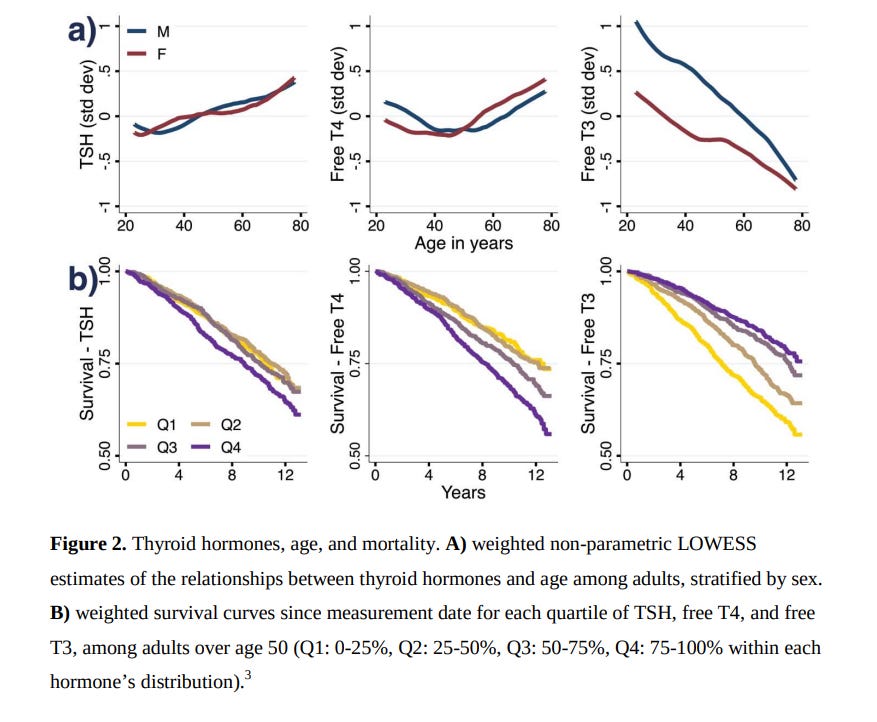
From: Sub-clinical triiodothyronine levels predict health, demographic, and socioeconomic outcomes
You can see that patients in the top range have a significant improvement in longevity and vitality compared to those in the bottom range.
Fourth quartile = 3.4-4.1 pg/mL
Third quartile = 3.1-3.4 pg/mL
Second quartile = 2.9-3.1 pg/mL
First quartile < 2.5-2.9 pg/mL
We need more than just a free T3 level to determine how to optimize thyroid hormone, but free T3 alone is a great prognostic marker.
Hemoglobin A1C
Hemoglobin A1C is a marker of the average glucose levels within your blood. Folks in the anti-aging and longevity space make much ado about hemoglobin A1C levels, but the truth about them may surprise you.
You can actually increase your risk of death by dropping your A1C too low.
Here is the data from one of the best studies on this:
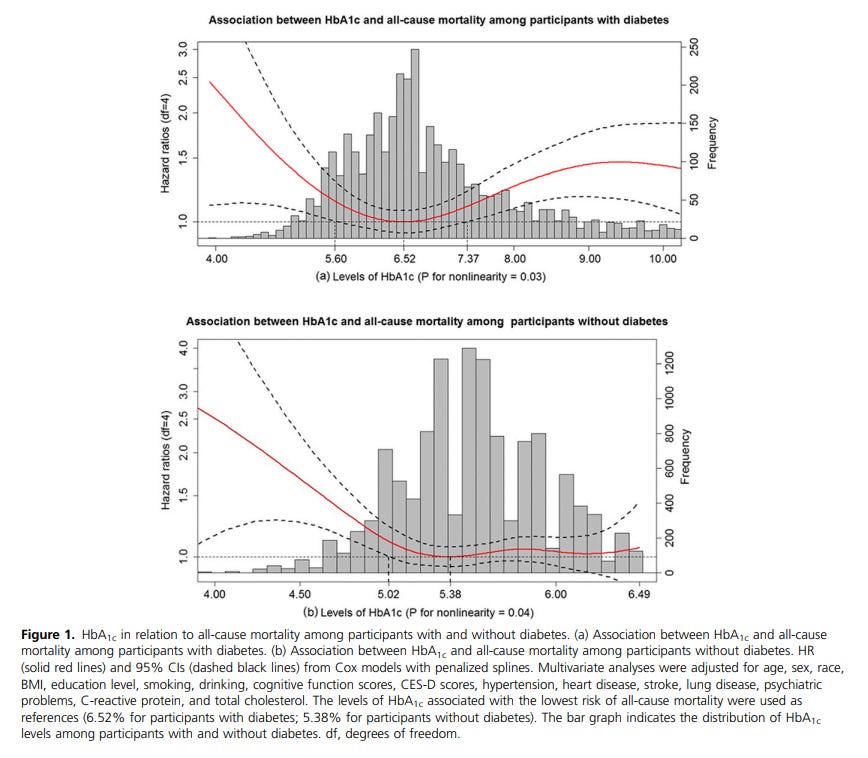
From: Glycated Hemoglobin and All-Cause and Cause-Specific Mortality Among Adults With and Without Diabetes
Why do diabetics have higher mortality at lower A1C levels? My theory is that their glucose transport and breakdown mechanisms are “rusty.” They do not work efficiently. Drop glucose levels too low, and all of a sudden they can experience “functional” hypoglycemia. By which I mean, their blood glucose levels are normal or even above average, but due to poor transport they cannot get glucose into their cells or break it down to create energy.
The irony is that many people are chasing rock-bottom A1C levels that will actually increase their risk of death.
What we also observe is that at lower levels of A1C, patients struggle to gain and maintain muscle mass, and to perform at a high level.
There are many, many things we can do to optimize A1C. We trend it every quarter until it is in the optimal range. As patients get older, we tolerate a higher level, depending upon their goals.
Fibrinogen Activity
Fibrinogen is a protein in your blood that breaks down to activate clotting. We need fibrinogen to stop bleeding, but high levels are associated with an increased risk of death. This is due to the increased risk of clotting, resulting in pulmonary embolism, heart attack, or stroke.
Here is your risk of death based on fibrinogen activity:
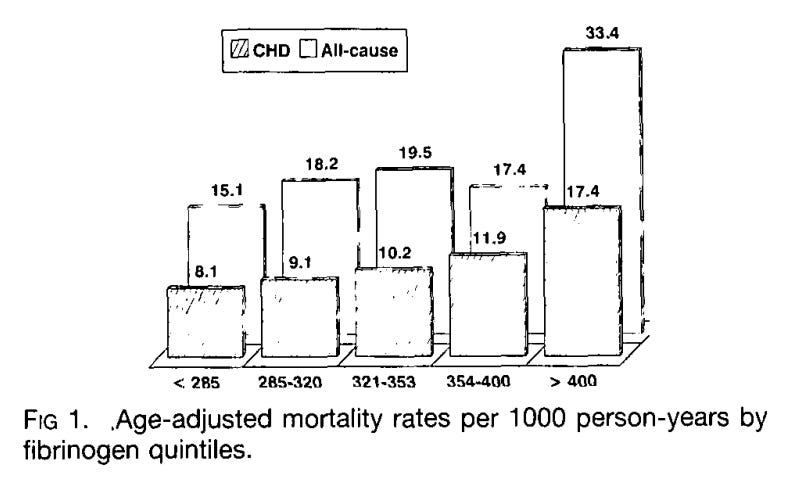
From: Fibrinogen Is a Predictor of Mortality in Coronary Heart Disease Patients
We trend fibrinogen until we push it ideally into the lowest range.
How We Use This Panel
This panel presents the best data we have regarding your overall health and vitality. There are many more markers we could have included, because every single lab we run has some bearing on your mortality and therefore longevity.
These are the markers that most strongly predict your overall risk for disease, disability, and death. Each of them has clear treatment options and I strongly believe these labs should be trended until they have normalized.
Ready to Take Control of Your Health?
Before you run out and buy labs, schedule an assessment with myself or a member of my team. We can help you find the right labs, so you don’t waste time and money on the wrong ones for you. Schedule an evaluation with a member of my team today.
Until next time, be well,
Dr. Stillman
References
1 Shani U, David L, et al Mortality in Antinuclear Antibody Positive Patients with and Without Rheumatologic Immune Related Disorders A Large Scale Population Based Study Medicina 2025 61 1 60
2 Chen Z, Li X, et al Association of Total Bilirubin With All Cause and Cardiovascular Mortality in the General Population J Clin Med 2021 10 18 4250
3 Li X, Zhang Y, He Z, et al J Shaped Association Between Serum Albumin Levels and Long Term Mortality of Cardiovascular Disease Front Cardiovasc Med 2022 9 1073120
4 Zhou S, Wang L, et al Association of High Sensitivity C Reactive Protein to Albumin Ratio With All Cause and Cardiac Death in Coronary Heart Disease Individuals PLOS One 2025 20 e0322281
5 Sun Y, Wang J, et al Iron Metabolic Biomarkers and the Mortality Risk in the General Population A Nationwide Population Based Cohort Study J Endocr Soc 2024 8 bvae063
6 Ellervik C, Birgens H, Tybjærg Hansen A, et al Total and Cause Specific Mortality by Moderately and Markedly Increased Ferritin Concentrations Copenhagen City Heart Study and Metaanalysis Clin Chem Lab Med 2014 52 6 889 896
7 Kieboom BCT, Niemeijer MN, Leening MJG, et al Serum Magnesium and the Risk of Death From Coronary Heart Disease and Sudden Cardiac Death J Am Heart Assoc 2016 5 1 e002707
8 Zeng X, Zhou Y, Zeng C, et al High Serum Copper as a Risk Factor of All Cause and Cause Specific Mortality Among US Adults NHANES 2011 2014 J Trace Elem Med Biol 2024 82 127045
9 Pilz S, Dobnig H, Winklhofer Roob B, et al Low Serum Zinc Concentrations Predict Mortality in Patients Referred to Coronary Angiography Br J Nutr 2009 101 10 1534 1540
10 Fan R, Yang J, Li Y, et al Association Between Homocysteine Levels and All cause Mortality A Dose Response Meta Analysis of Prospective Studies Sci Rep 2017 7 4769
11 Tutak AS, Findikli HA Could Urine pH be a New Parameter for Mortality Progress Nutr 2021 23 3 429 436
12 Lawton RI, et al Sub Clinical Triiodothyronine Levels Predict Health Demographic and Socioeconomic Outcomes PNAS 2024 121 17 e2308652121
13 Li FR, Zhang XR, Zhong WF, et al Glycated Hemoglobin and All Cause and Cause Specific Mortality Among Adults With and Without Diabetes J Clin Endocrinol Metab 2019 104 8 3345 3354
14 Benderly M, Nakhoul F, et al Fibrinogen Is a Predictor of Mortality in Coronary Heart Disease Patients Atherosclerosis 1996 124 3 351 356